


This website stores cookies on your computer. These cookies are used to improve your website experience and
provide
more personalized services to you, both on this website and through other media. To find out more about the
cookies
we
use, see our Privacy Policy.
We won't track your information when you visit our site. But in order to comply with your preferences, we'll have
to
use just one tiny cookie so that you're not asked to make this choice again.
EIS test of EINHEL Li battery
Source:Corrtest
Time:2025-09-10
View:0
EIS test of EINHEL Li battery
Experiment setup
Experiment setup
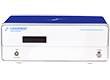
Instrument: CS350M potentiostat/galvanosatat
Technique: Potentiostatic EIS
Parameters: frequency range: 100k Hz ~0.01Hz, 10 points/decade, AC Amplitude: 5 mV, DC potential: 0 V vs. OCP.
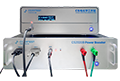
We used 2-electrode mode for Eis test of the battery cell. The green WE and white SENSE alligators were connected together to the positive electrode, the yellow RE and red CE alligators connected together to the negative electrode. As the voltage was high for the EINHEL Li battery module, we disassembled it and took 2 single battery cells(3.85V) for EIS test.

Fig. 1 EIS test parameter setting interface
Single Li-ion cell
We disassemble the battery module, and take two single cells to do the EIS test. The results are shown in Fig. 2.

Fig 2. EIS of the single cell
In Figure 2, The red and black curve represents the impedance spectrum of the two battery cells, respectively. There is a typical capacitance arc in high-frequency region. The oblique line in the low-frequency region may be related to the diffusion of lithium ions. Therefore, Warburg impedance is used.

Fig 3. equivalent circuit of the single cell

Fitting results using the equivalent circuits mentioned above
There are performance differences between the two lithium-ion battery cells. Cell #1 exhibits a lower internal resistance (Rs) and a higher double-layer capacitance (Cdl) of 2.374 F, indicating that its electrode active material has a larger effective surface area(ECSA) compared to Cell #2, resulting in greater charge storage capacity. This observation is further supported by the charge transfer resistance (Rct), where Cell #1 shows a smaller Rct than Cell #2. These results suggest that Cell #1 is in a better condition than Cell #2.
As reported in the literature, the quality of lithium-ion cells can be evaluated based on Rs and Rct values - the smaller these parameters, the better the cell performance.
About Us Potentiostat/Galvanostat Accessories Support Contact Us
Copyright By © 2008-2026 Wuhan Corrtest Instruments Corp., Ltd
 Contact Us
 +86 13469965984
Decline
Accept