


This website stores cookies on your computer. These cookies are used to improve your website experience and
provide
more personalized services to you, both on this website and through other media. To find out more about the
cookies
we
use, see our Privacy Policy.
We won't track your information when you visit our site. But in order to comply with your preferences, we'll have
to
use just one tiny cookie so that you're not asked to make this choice again.
Electrochemical measurements of the supercapacitor
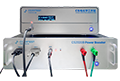
Source:Corrtest
Time:2025-09-10
View:0
Electrochemical measurements of the supercapacitor
Background
Supercapacitor is a new type of energy storage device with the advantages of short charging time, long service life, energy saving and environment-friendliness, etc. It has wide applications. It can be used as a balanced power supply for lifting equipment, or vehicle’s starting power supply or the energy storage of other electromechanical equipment, etc. The materials used for supercapacitor’s electrode include various carbon materials, metal oxides and conductive polymers etc. Since the conductive polyacetylene film was successfully synthesized in 1970, scientists have shown a strong interest in conductive polymers.
The main indicators of the supercapacitor are specific capacity, charge and discharge rate, cycling life, etc. CorrTest potentiostats / galvanostats includes the galvanostatic charge and discharge(GCD) method to efficiently evaluate the cycle life of supercapacitors.
Electrochemical methods
1. Cyclic Voltammetry (CV)
The capacity of the supercapacitor can be calculated from below formula:
 (1)
(1)
For a capacitor, the cyclic voltammetry test is performed at a certain scan rate (n). In the charging state, the current (i) is a constant positive value, the current is a constant negative value in the discharging state. This appears as an ideal rectangle on the CV graph. Since redox reactions may occur at the interface, the actual CV graph of an capacitor will always deviate slightly from the rectangle. Therefore, the shape of the CV curve can reflect the capacitance performance of the material. For double-layer capacitors, the closer the CV curve is to a rectangular shape, the more ideal the capacitive performance; and for pseudo capacitors, we can determine which redox reactions have occurred in the system from the position of the redox peaks shown in the CV curve.
(1) Parameters setting
The CV sweep starts from Vertex 1 E to Vertex 2 E. You can set the scan rate according to your requirement. If the scan rate is relatively high(eg:100 mV/s), you should set relatively high frequency(eg:100 Hz) for the data acquisition to ensure the small potential intervals(1mV). During the first cycle scan, the electrode surface may not reach equilibrium, therefore the CV curve may not be fully closed. It’s necessary to perform more cycles.

Fig 1. CV Parameters setting
(2) Example of the CV

Fig 2. CV curves at various scan rate
2. EIS Test
EIS can reveal the kinetic details of charge transfer and mass diffusion of electrode materials at the electrode/electrolyte interface. It can calculate the equivalent series resistance of capacitors, solution resistance, double layer capacitance of material/electrolyte interface, and pseudocapacitance, etc.
(1) Parameters setting
The AC amplitude is usually set to be 10 mV, frequency range is 105~10-2 Hz. The EIS data can be analyzed in CS Analysis software, where an equivalent circuit is built. Through the full-frequency fitting, the electrochemical parameters related to capacitor’s charge and discharge can be calculated.

Fig 3. Parameters setting of EIS test
(2) Example of the EIS test

Fig 4. EIS result and the equivalent circuit
3. Galvanostatic charge and discharge (GCD)
Specific capacitance is calculated according to the following formula:
 (2)
(2)
Where, I is charging(discharging) current. Dt is charging(discharging) time, DV is charging(discharging) potential difference, m is the mass of active material (Please note: m cannot be 0, otherwise the software will give an error prompt.)
Through many times of cycling, we can evaluate the cyclic lifespan of the capacitor. By observing whether the charging and discharging curve are symmetric, we can judge whether charging and discharge, and the electrochemical reactions are reversible.
(1) Parameters setting
During the discharge a negative current should be set. You can set the condition of switch between charge and discharge based in voltage.

Fig. 5. Parameters setting for GCD
(3) Example of the GCD

Fig 6. GCD at different current density

Fig 7. 1A/g: specific capacitance - number of cycle
About Us Potentiostat/Galvanostat Accessories Support Contact Us
Copyright By © 2008-2026 Wuhan Corrtest Instruments Corp., Ltd
 Contact Us
 +86 13469965984
Decline
Accept